- Have any questions?
- 647-247-6414
- [email protected]
The Shared cM Project
Can anyone explain what this chart means?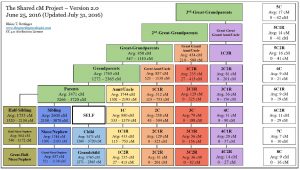
https://practice.jgstoronto.ca/research_resources/shared-cm-project/
Can anyone explain what this chart means?
https://practice.jgstoronto.ca/research_resources/shared-cm-project/